Ask most practice owners their collection rate and you'll hear "about 95 percent." Measure it properly and the real number is often lower. Industry analysts note that many practices reporting around 95 percent are actually collecting 88 to 92 percent of what they produce.
The difference between where you are and where you should be is your collection gap. A 9 point gap sounds small. It isn't.
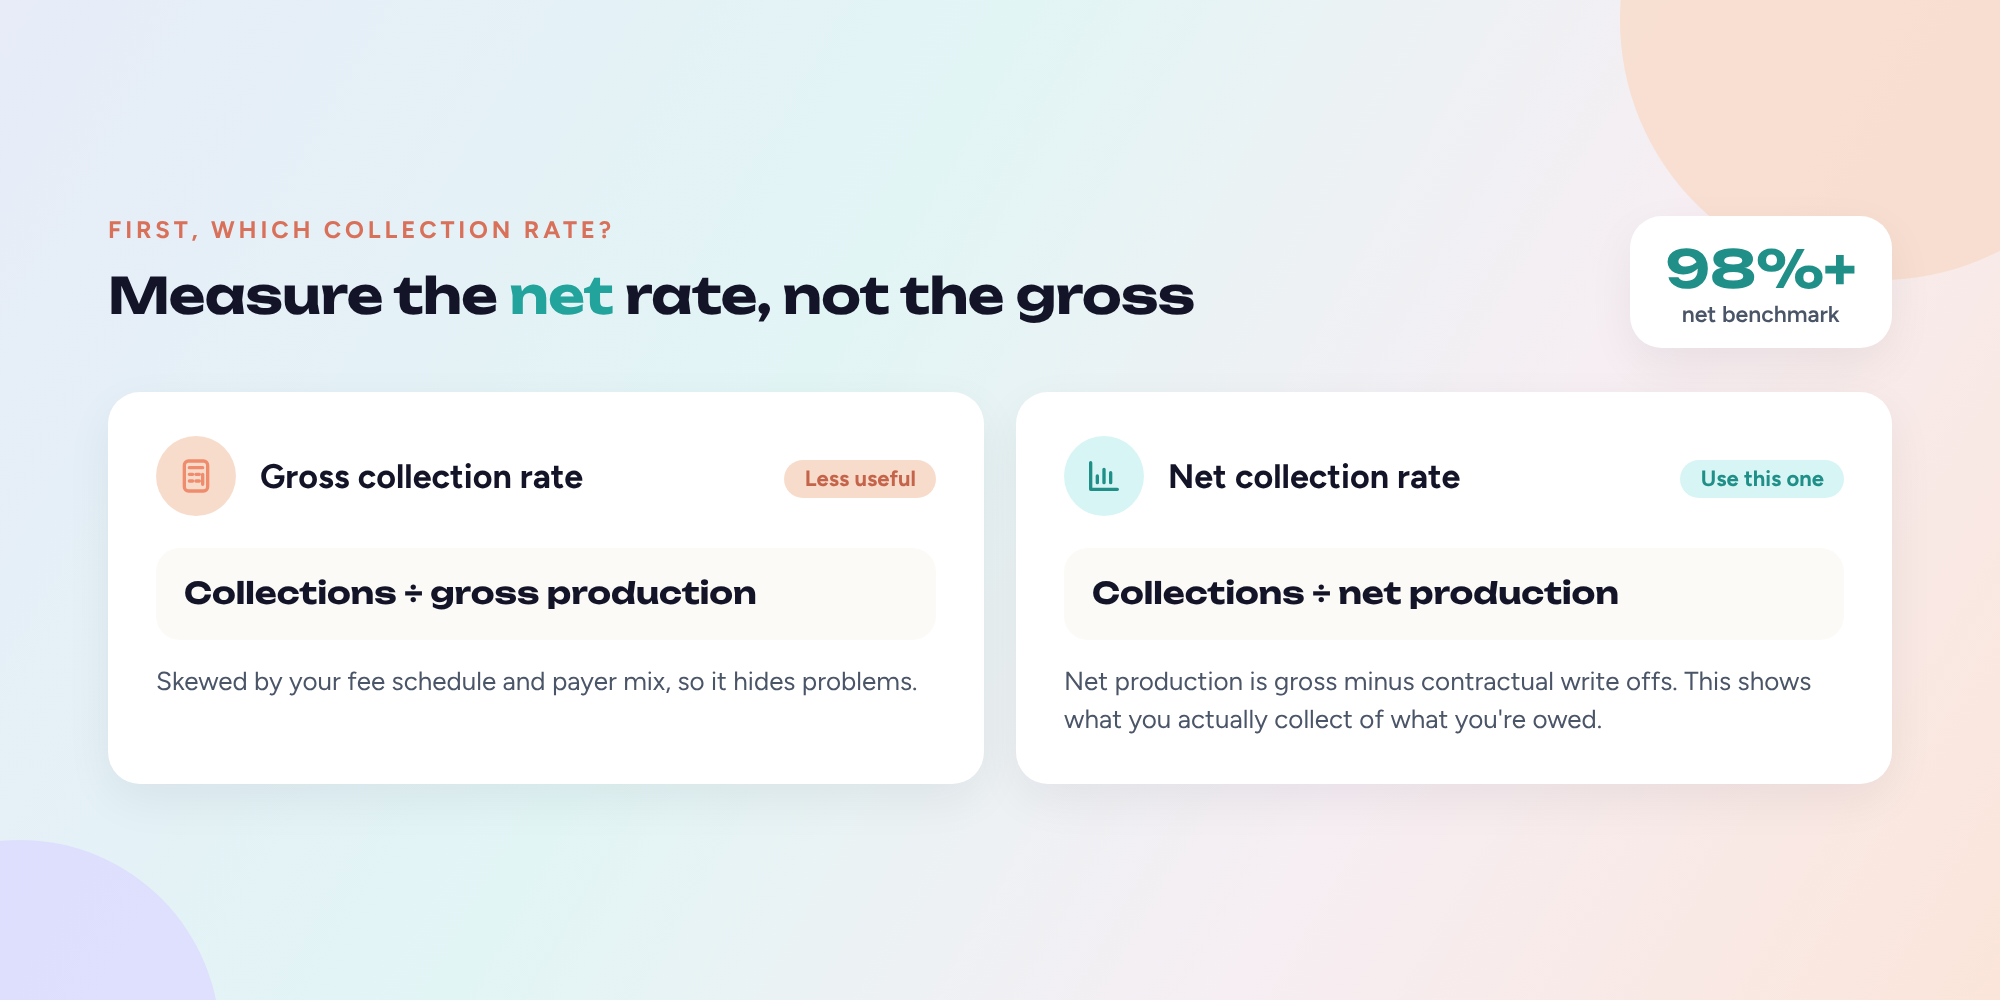
First, which collection rate?
There are two ways to measure it, and they tell you different things.
- Gross collection rate = collections ÷ gross production. This is skewed by your fee schedule and payer mix, so it's not great for spotting problems.
- Net collection rate = collections ÷ net production, where net production is gross production minus contractual write offs. This is the number that shows whether you're collecting what you're actually owed.
The common benchmark for net collection rate is 98 percent or higher, measured over a full year. Consistently below 95 percent usually means something in the revenue cycle is broken.
The math on a 9 point gap
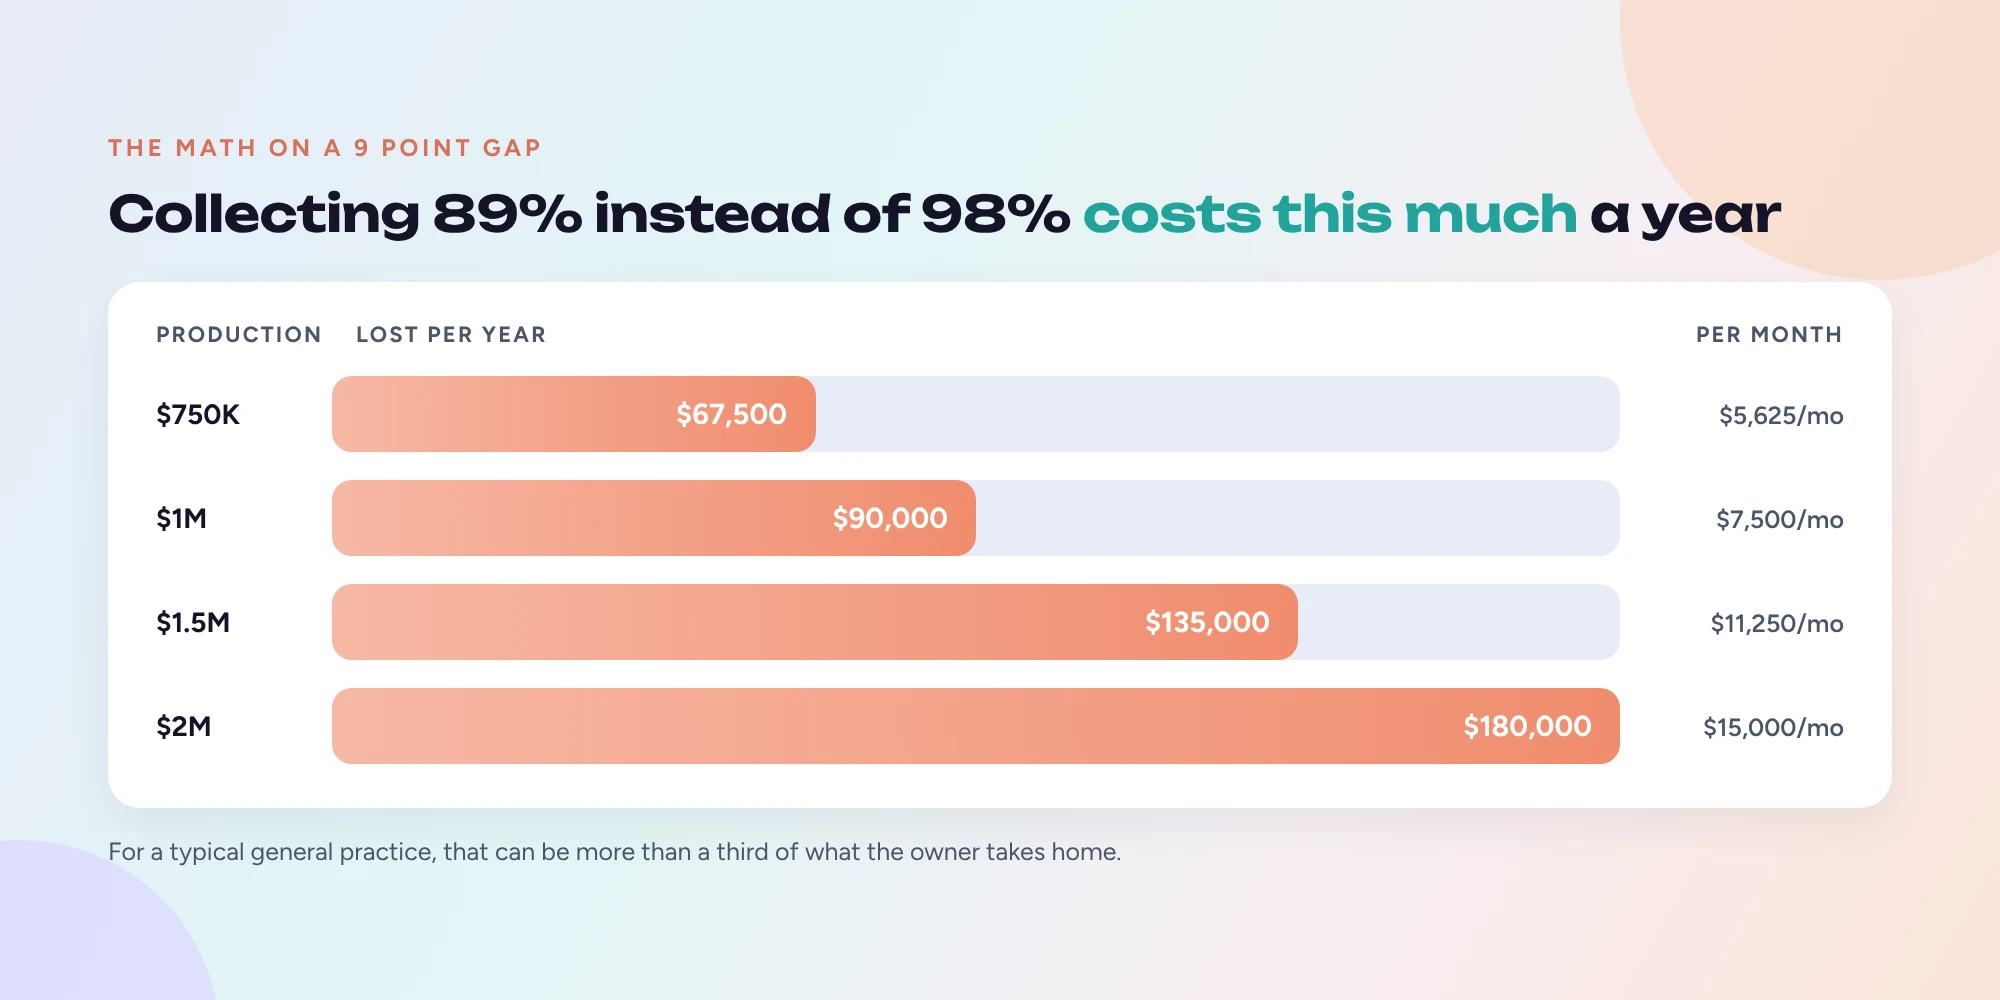
Take a practice that should be collecting 98 percent but is actually collecting 89 percent. The gap is 9 percent of net production, every year.
| Annual net production | Collected at 98% | Collected at 89% | Lost per year | Lost per month |
|---|---|---|---|---|
| $750,000 | $735,000 | $667,500 | $67,500 | $5,625 |
| $1,000,000 | $980,000 | $890,000 | $90,000 | $7,500 |
| $1,500,000 | $1,470,000 | $1,335,000 | $135,000 | $11,250 |
| $2,000,000 | $1,960,000 | $1,780,000 | $180,000 | $15,000 |
For context, the ADA's Health Policy Institute puts average gross billings for a general dentist owner at about $966,000, and average general dentist net income at about $215,000. For a typical practice, a 9 point gap can be worth more than a third of what the owner takes home.
And unlike a new patient campaign or a fee increase, closing the gap doesn't require more production. It's money you've already earned.
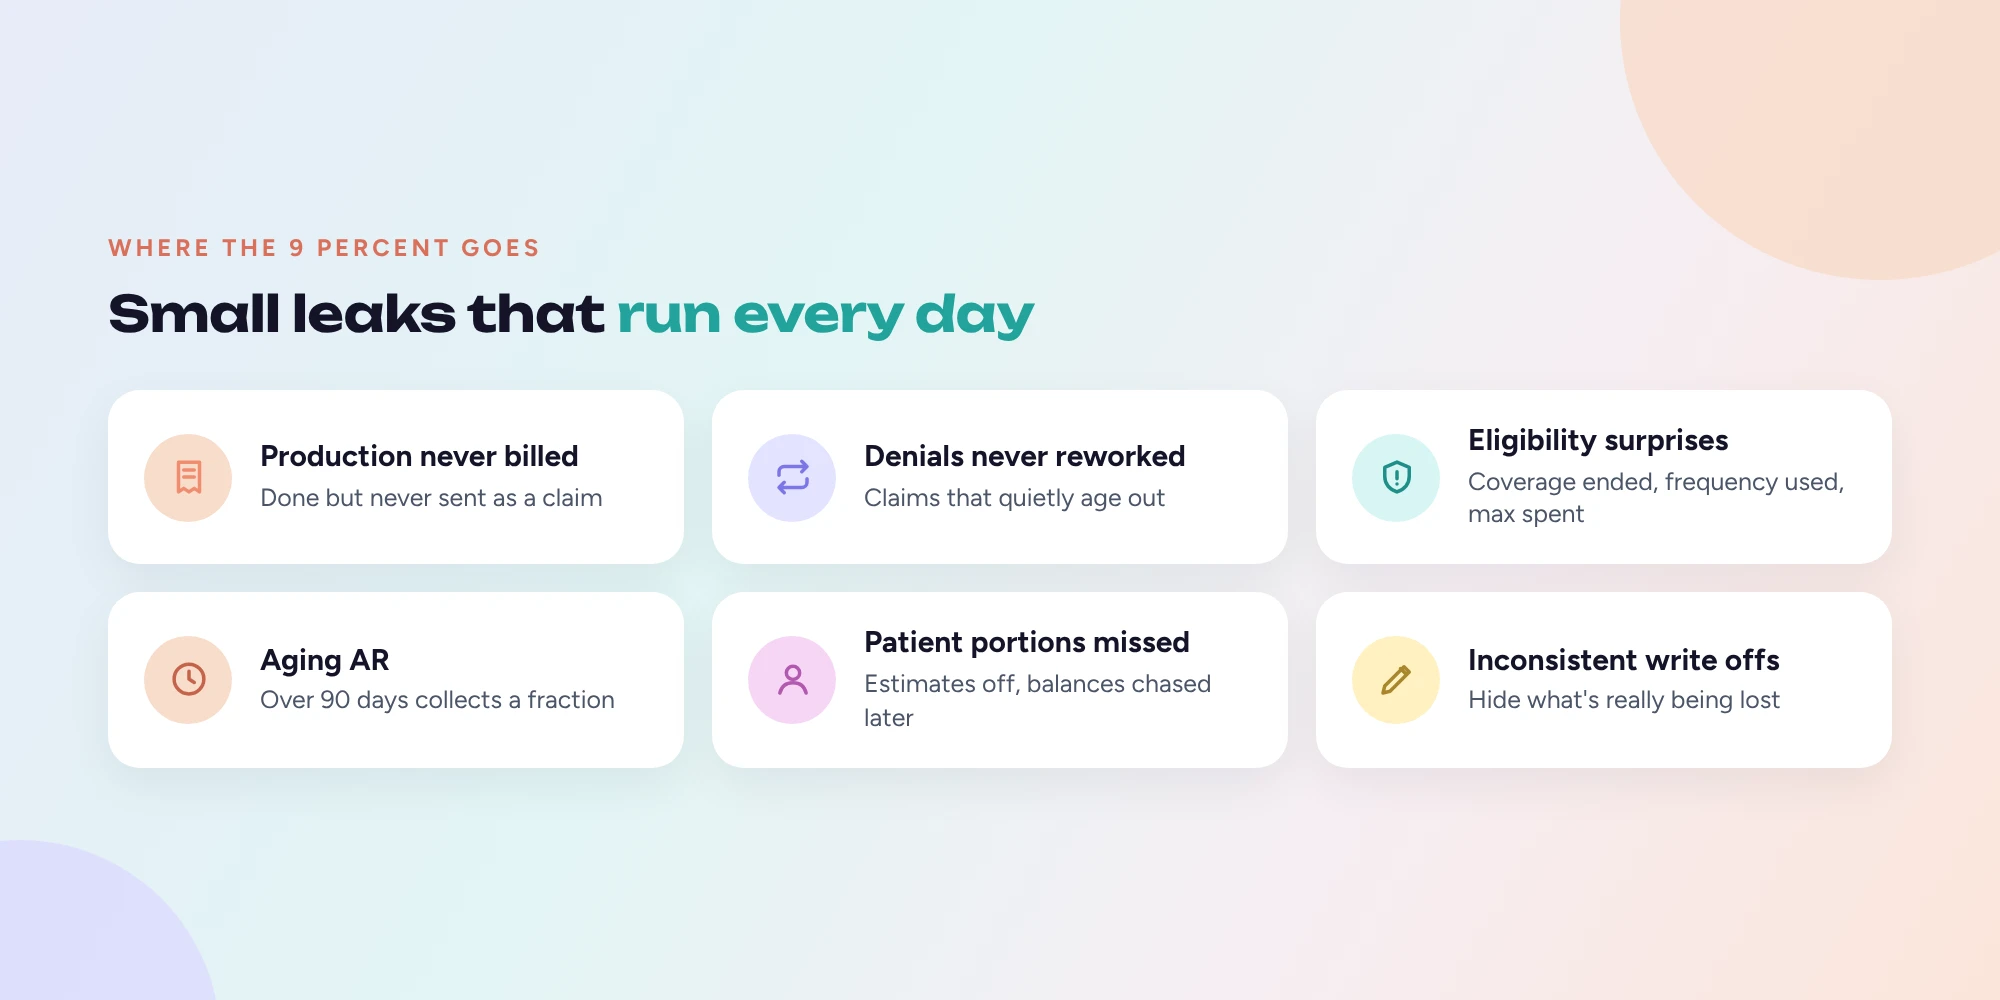
Where the 9 percent goes
Collection gaps rarely come from one big failure. They come from small leaks that run every day:
- Production that never becomes a claim. Procedures completed but never billed, or billed late. Some analysts estimate this alone can be 5 to 15 percent of documented production.
- Denials that are never reworked. Many denied claims are eventually paid when someone follows up, but that takes multiple resubmissions and weeks of waiting. The ones nobody follows up on just age out.
- Eligibility and benefit surprises. Coverage that ended, a frequency already used, a maximum already spent. The claim is denied and the balance shifts to a patient who wasn't expecting it.
- Aging accounts receivable. A healthy target is less than 20 percent of insurance AR over 90 days. Many practices sit at 35 to 50 percent, and balances over 90 days are collected at a fraction of their value.
- Patient portions not collected at the visit. Inaccurate estimates lead to balances that are harder to collect later.
- Inconsistent write offs. Adjustments posted to the wrong category hide what's really being lost.
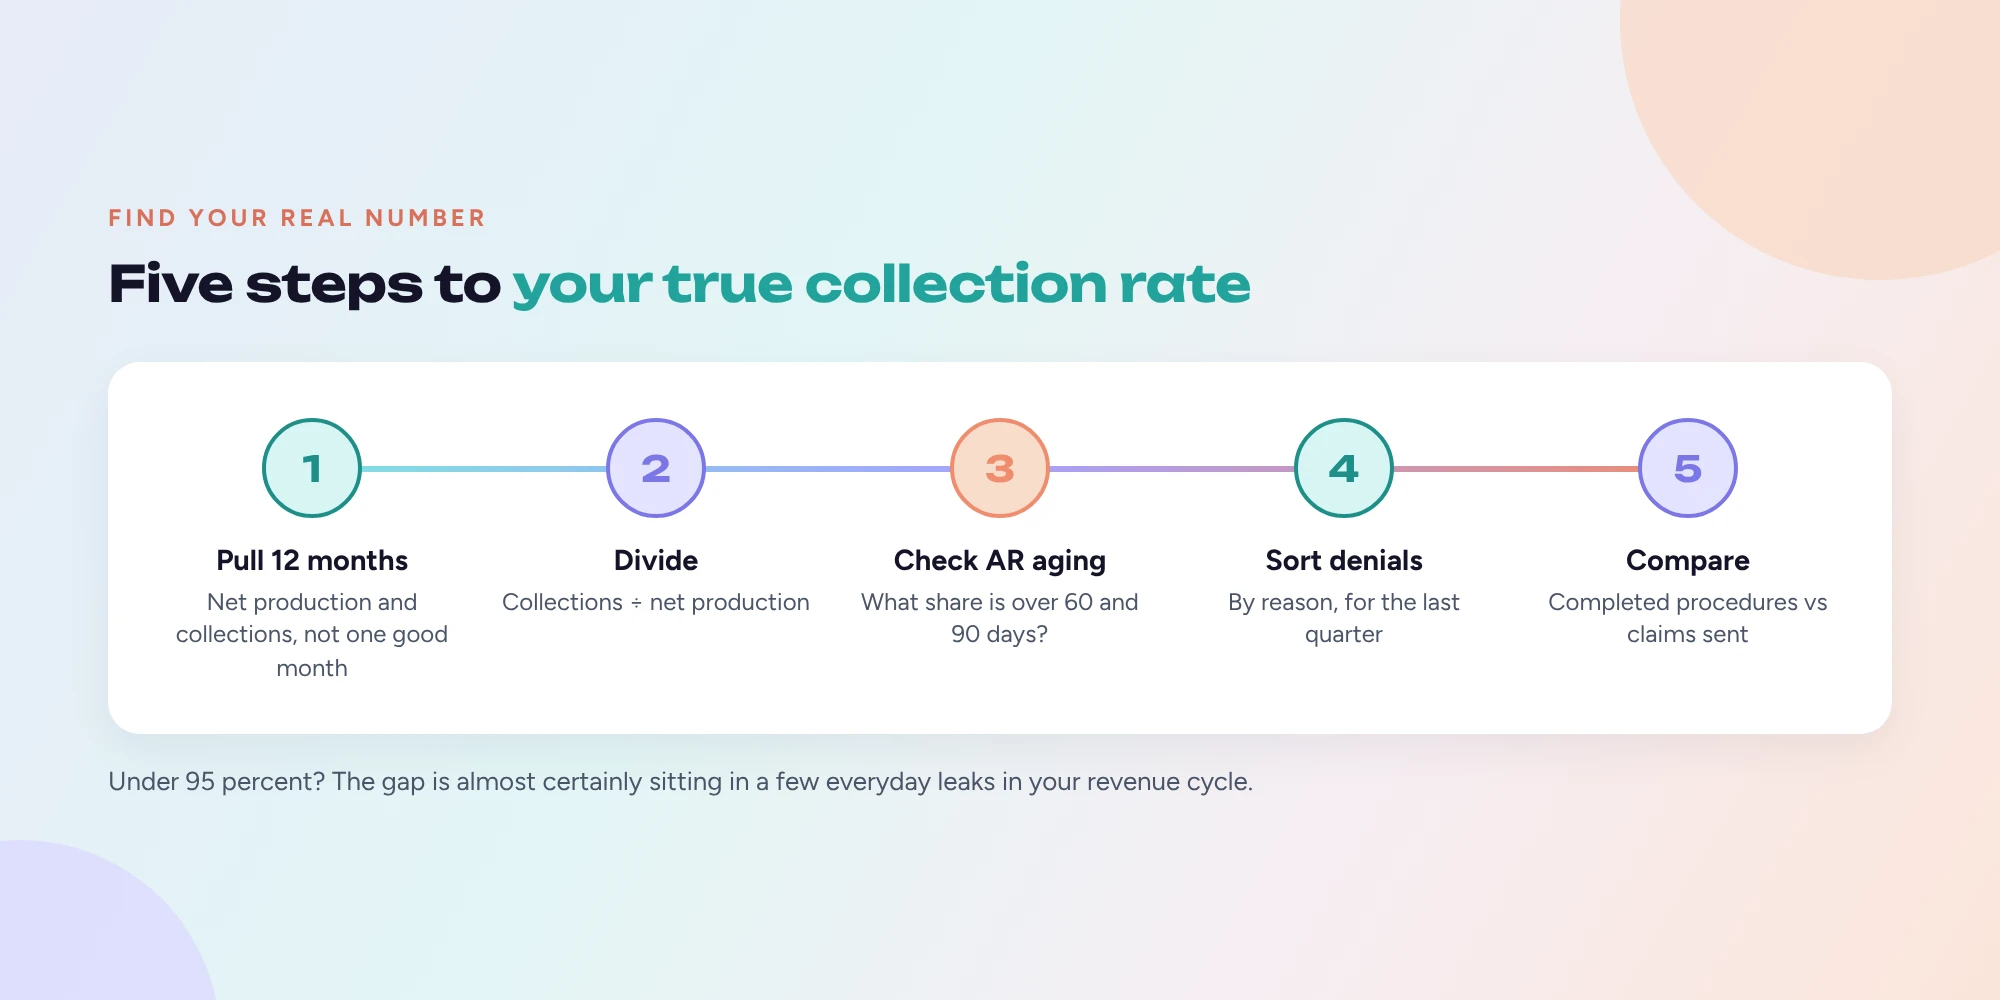
How to find your real number
- Pull net production and collections for the last 12 months, not one good month.
- Divide collections by net production.
- Check your insurance AR aging. What percent is over 60 and 90 days?
- Look at denials by reason for the last quarter.
- Compare completed procedures against claims sent, to catch production that never got billed.
If you're under 95 percent, the gap is almost certainly sitting in one of the leaks above.
Closing the gap
The practices that collect 98 percent or more tend to do the same things well:
- Verify full benefits before every visit, not just active coverage
- Send claims the same day, with the right attachments
- Work every denial within days, not weeks
- Post payments promptly so AR reflects reality
- Give patients accurate estimates and collect their portion at checkout
None of it is complicated. All of it is repetitive, time consuming and easy to fall behind on when the front desk is stretched thin.
The bottom line
A 9 point collection gap can cost a typical practice tens of thousands of dollars a year, and larger practices six figures. The fix isn't more production. It's making sure the work you already do gets paid.
Dental Maverick automates the insurance work that drives collections, from verification to claims to payment posting. Join the waitlist at dentalmaverick.ai.